

Introduction
In 2026, Asia-Pacific is not just recovering—it is expanding at a pace that is redefining global aviation. Every few weeks, the region is effectively adding the equivalent traffic of a mid-sized international hub. The challenge is no longer simply moving passengers; it is doing so efficiently, affordably, and sustainably.
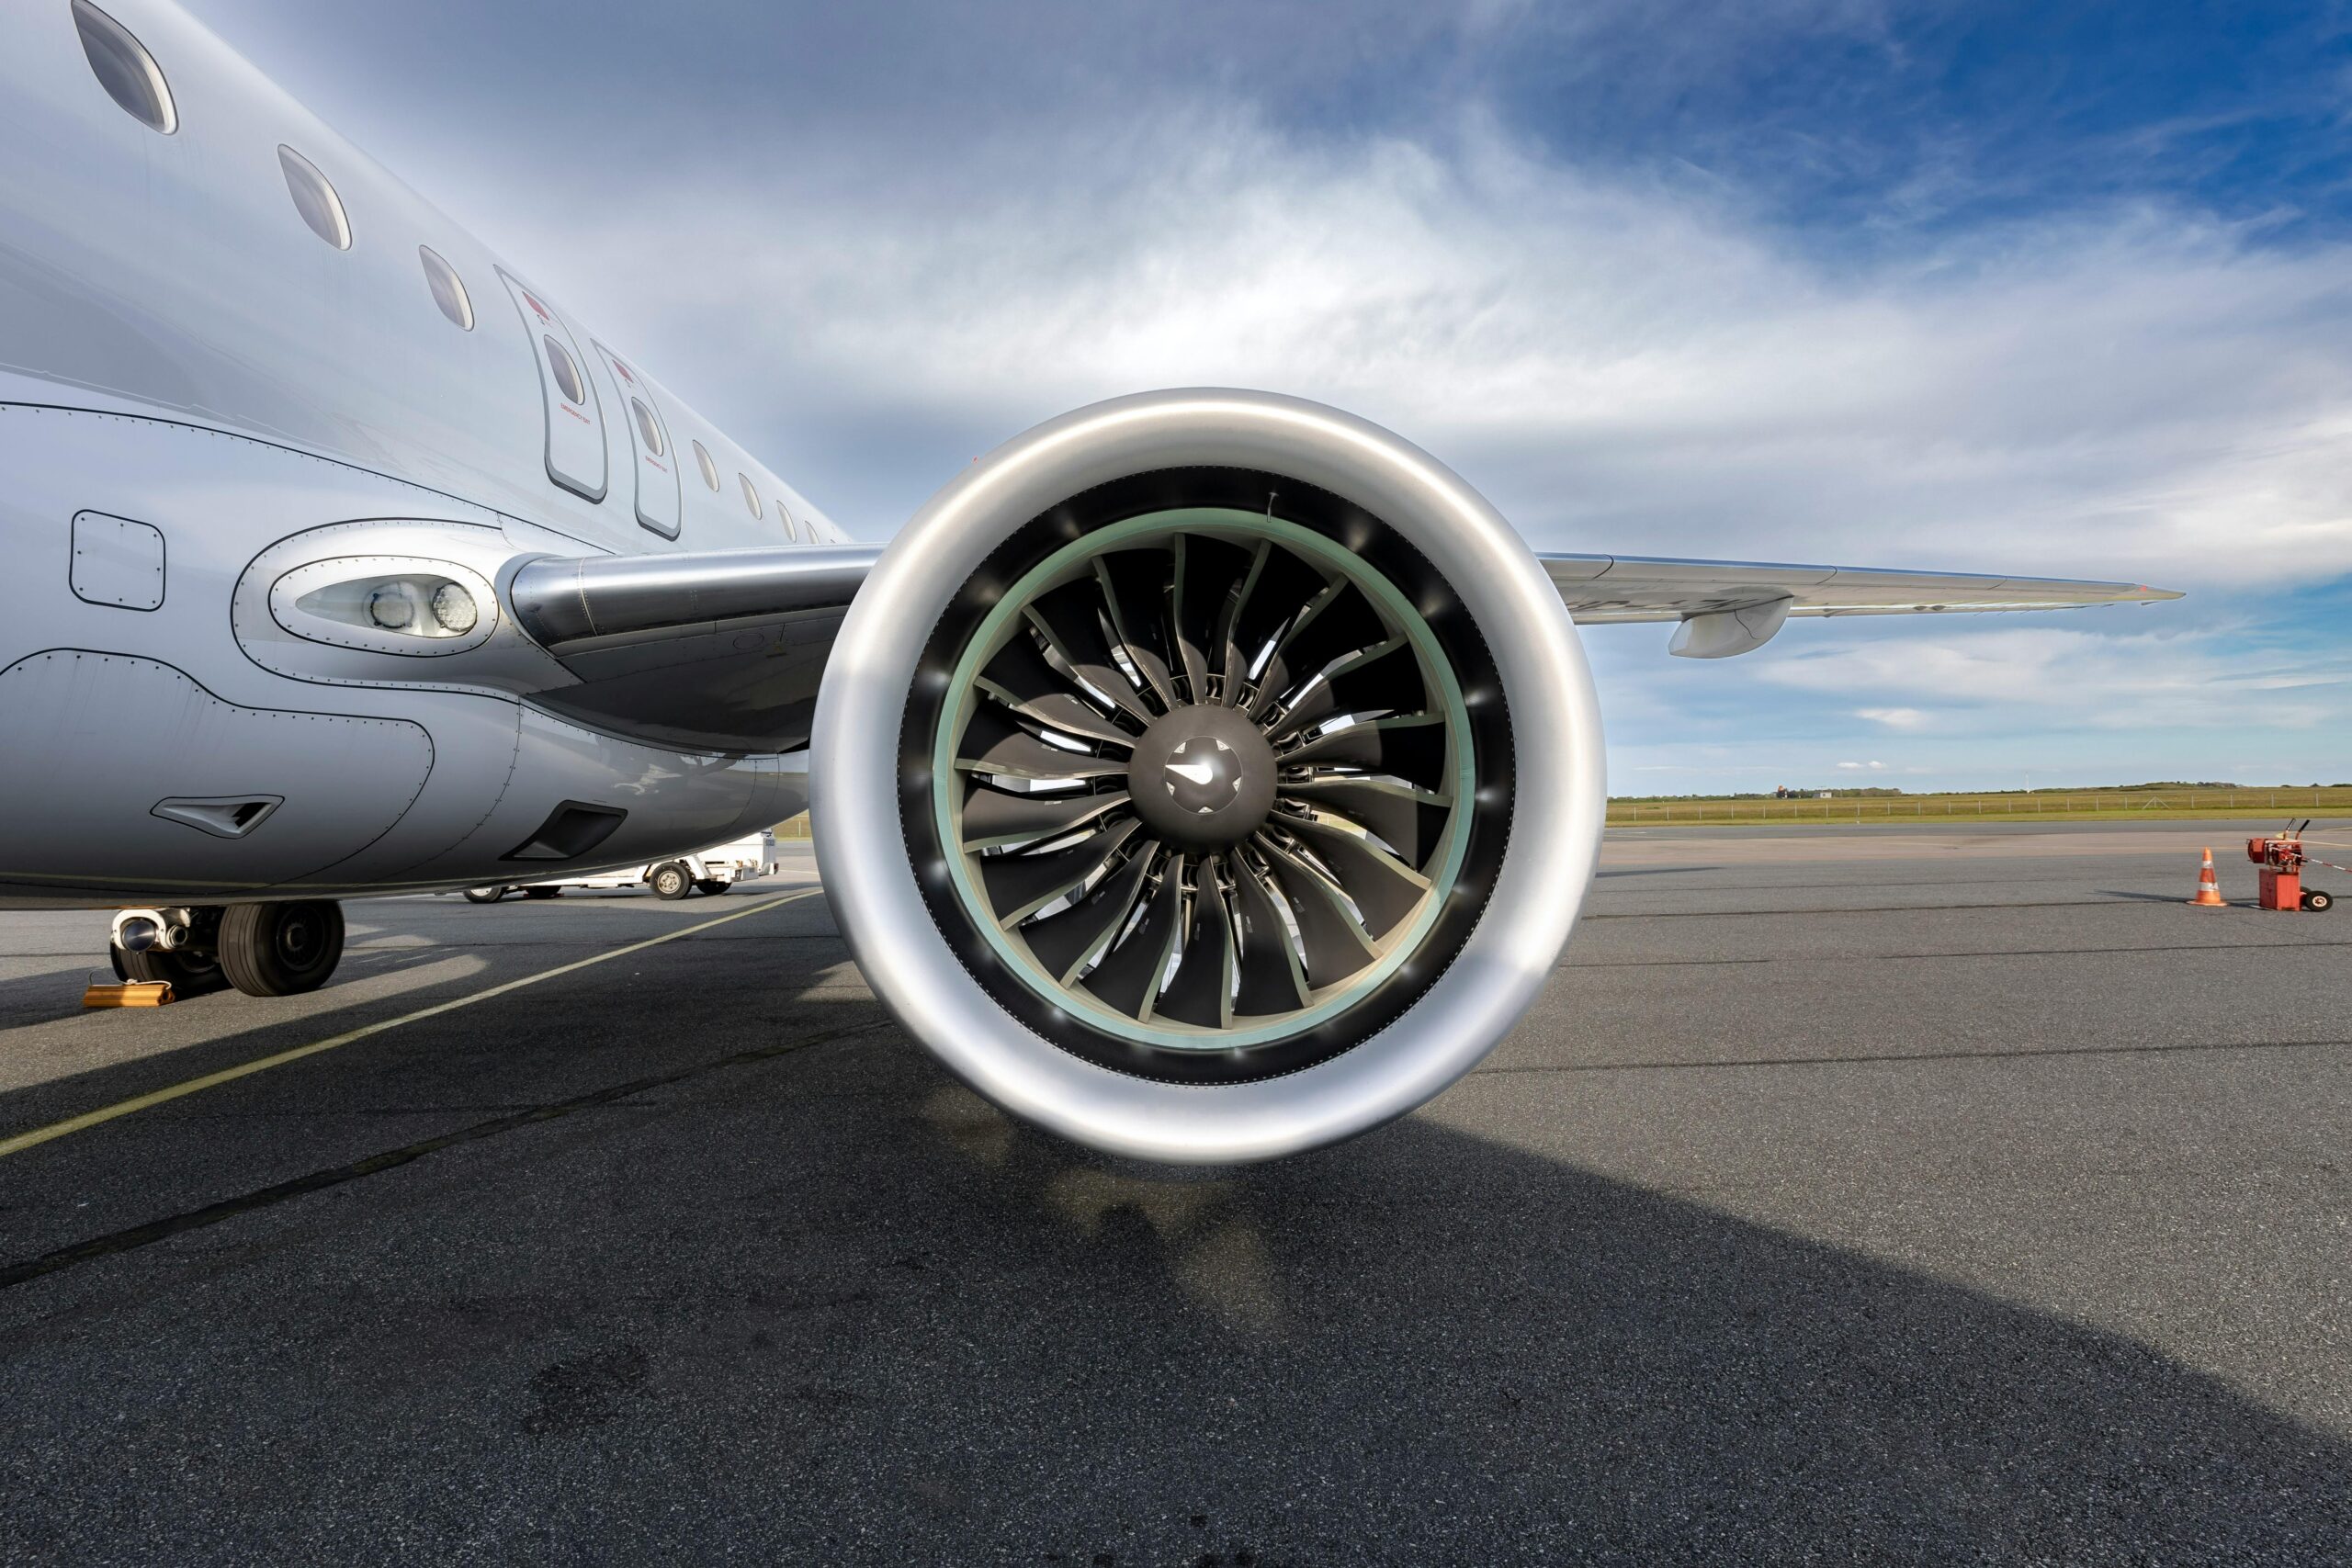
At the center of this transformation is the aircraft engine.
Modern engines are now being asked to solve a three-sided equation simultaneously—support surging demand, reduce operating costs in a volatile fuel environment, and meet increasingly stringent environmental expectations. The result is a quiet but profound shift in propulsion technology, reshaping how aircraft are deployed across Asia’s dense and fast-evolving networks.
Traffic Growth Trends in Asia-Pacific
Industry-informed estimates, drawing on aggregated data from organizations such as the International Air Transport Association and Airports Council International, highlight a region firmly in sustained growth mode.
Table 1: Asia-Pacific Air Traffic Indicators (2024–2026)
| Indicator | 2024 Estimate | 2025 Estimate | 2026 Projection |
|---|---|---|---|
| Passenger Traffic (billion RPK) | 3.9 | 4.6 | 5.2 |
| Annual Growth Rate (%) | 18% | 15% | 13% |
| Aircraft Movements (millions) | 32 | 36 | 40 |
| Load Factor (%) | 81% | 83% | 84% |
Growth is moderating slightly but remains structurally strong, placing pressure on propulsion systems to deliver high reliability under intensive utilization cycles.
Engine Technology Mix in 2026
Table 2: Fleet Engine Composition (Asia-Pacific, 2026)
| Engine Type | Share of Active Fleet | Primary Role |
|---|---|---|
| High-bypass turbofan | 68% | Mainline jet operations |
| Geared turbofan (GTF) | 14% | Fuel-efficient short/medium haul |
| Turboprop | 12% | Regional connectivity |
| Legacy engines | 6% | Cargo and niche operations |
High-bypass turbofans remain dominant, while geared turbofans represent the fastest-growing segment due to their efficiency advantages.
Efficiency Gains and Cost Implications
Table 3: Indicative Engine Performance Improvements
| Engine Generation | Fuel Burn Improvement* | Noise Reduction* | Maintenance Interval |
|---|---|---|---|
| Previous-generation | Baseline | Baseline | 6–8 years |
| Advanced turbofan | Up to 12–15% | Up to -30% | 8–10 years |
| Geared turbofan | Up to 16–20% | Up to -50% | 10–12 years |
*Typical reported ranges based on industry data.
Sustainable Aviation Fuel (SAF) Integration
Table 4: SAF Adoption Metrics (Asia-Pacific, 2026)
| Metric | Estimated Value |
|---|---|
| SAF share of total jet fuel | 2–3% |
| Airports with SAF availability | ~25% |
| Modern engines SAF-compatible | ~100% |
Operational Performance and Maintenance Trends
Table 5: Engine Operational Metrics (2026)
| Metric | Typical Range |
|---|---|
| Daily utilization (hours) | 10–14 |
| Average cycles per day | 4–6 |
| Time on wing (years) | 8–12 |
| Unscheduled removal rate | 2–5% |
Future Propulsion Outlook
Table 6: Emerging Engine Technologies Timeline
| Technology | Status (2026) | Expected Entry Into Service |
|---|---|---|
| Hybrid-electric | Prototype stage | 2030–2035 |
| Hydrogen propulsion | Demonstration | 2035–2040 |
| Open rotor systems | Advanced testing | Early 2030s |
Conclusion
Aircraft engines are no longer just technical components—they are strategic assets shaping the trajectory of Asia-Pacific aviation. Efficiency, sustainability, and reliability will define the next phase of growth, and propulsion technology sits at the center of that evolution.


